


Blog Updated: December 2022
Sometimes we just need a visual to fully understand a concept. So, in this post we’re sharing an example of a solar cash flow table that we typically include in solar proposals for residential customers. If you want to know how much solar panels save and how they pay for themselves over time, this post will walk through both.
How much do solar panels save?
The savings from a solar panel system can be looked at on a monthly basis and over the lifetime of a system. Monthly savings will depend on how much energy you use and how much energy is offset by your solar system. We strive to design each system to offset 100% of your electricity usage. Over the lifetime of a system, solar will pay for itself and then some. It’s not uncommon to see a system pay for itself twice over during its 30-year lifespan! That’s some great return on investment (ROI).
How long is the payback period?
We explained how long it takes solar to pay for itself in a previous blog, but here’s a refresher. Before going solar, you pay your utility company for the electricity you consume in your home every month. You are also subject to utility rate increases, so your bill may go up year over year. Installing a solar system on your home changes the game. With solar, you own your energy production and energy you produce goes towards lowering your utility bill. When the value of your savings equals the net cost of the PV system, it has paid for itself!
We use payback period as one measure of the ROI of a solar system. In the most basic terms, payback period takes the overall system price and divides it by the average projected solar savings for each year to find out how long it will take for solar panels to pay for themselves. The solar cash flow table shows how that process works in more detail and what we factor in to determine payback period.
Keep in mind that the payback period is different for every solar installation depending on a variety of factors, but we tend to see an average payback period between 12-15 years.
Some key factors that affect payback period:
- Overall system cost: A properly sized system will maximize your savings and return on investment (ROI). The average system size that we installed in 2021 was 7.75kW and the cost ranged from $27,000- $32,000 before factoring in the federal tax credit.
- System size: Larger, more complex systems cost more up front. But, the larger the system, the quicker the payback period is generally. These homes have higher electricity usage and are therefore saving more each month with solar.
- Electricity usage: Customers who use more electricity can benefit the most from solar. Instead of paying the utility company each month, these homeowners are building equity through solar.
- Layout and install: The complexity of your layout and install has a big impact on the original cost of the solar system.
- Roof material: Certain roof materials are easier to install on and can affect the price of the installation.
- Solar incentives: There are local and federal incentives and rebates that you can earn for going solar. The solar Investment Tax Credit (ITC) is a 30% credit that you can claim once you install solar.
An example cash flow table from one of our customers:
*NOTE: this cash flow table factors in the previous 26% solar Investment Tax Credit, not the current 30% tax credit.
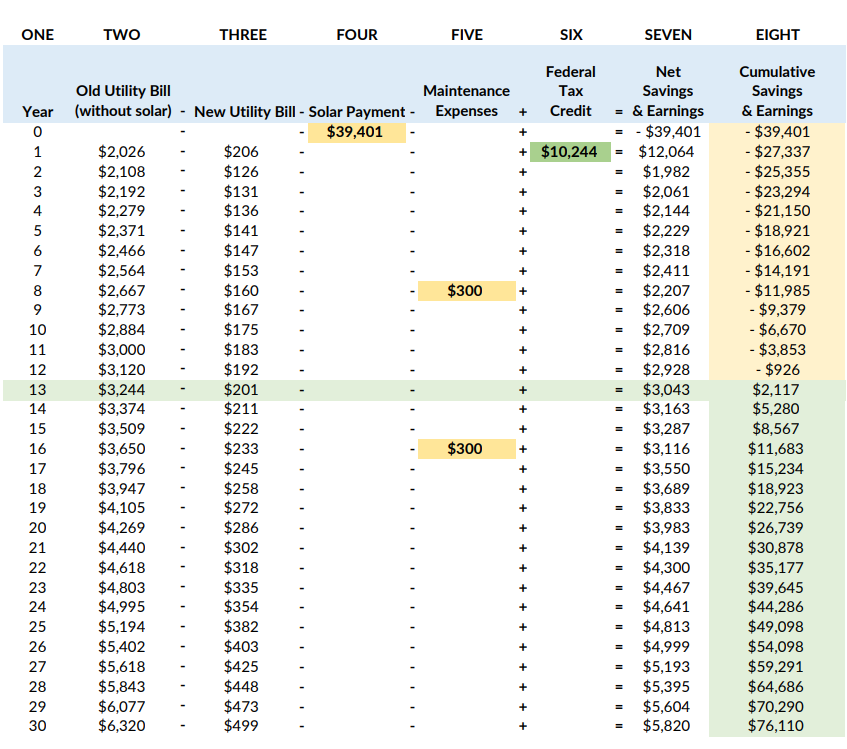
We’ll walk you through the table step by step:
Solar might seem like a new cost at first, but when we look at this table, we see an opportunity to build energy equity (just like when you buy a house as an investment that can help build wealth over time). This table is from the quote of one of our customers who was installed in September 2021.
The second column in the chart shows the yearly cost of utility bills this homeowner would be paying to the utility company. Due to inflation, these costs will continue to rise, and on top of basic inflation of costs, instability in the energy market can also increase prices. Citing hurricane damage to facilities and increase in demand, Xcel requested approval to increase electricity rates in 2021 – they estimated that a typical residential customer might see their cost jump up 14%. In addition to adding stability to your energy prices, homeowners with solar save more and reach their payback period sooner as electricity costs rise.
Column three shows the new yearly utility bill. All utility companies charge a connection fee to still be connected to the grid, so while your PV array can reduce the number of kilowatt hours you purchase from the utility, there will still be a small bill to the utility company on a monthly basis.
The fourth column shows the complete cost of the solar system and installation. For our homeowner in this example, the total cost was just over $39,000 for their system, and they paid in full up front. We also factor in possible system maintenance costs in column five. Column six shows the customer’s earnings from filing for the solar ITC. They will be able to claim $10,244 once their solar system is installed.
Column seven shows the gradual increase in savings that occurs the longer the customer has had the system. These savings are simply calculating the [old utility bill – new utility bill + tax credits or incentives = yearly net savings and earnings]. This includes a yearly electricity escalator of 4%.
Finally, we get to column eight, which shows the cumulative savings over the lifetime of the system. You can see when the column turns from yellow to green in year 13 – that is when the solar system has fully paid for itself and will continue generating savings for the customer from then on. After its 30-year lifetime, this system is expected to return approximately $76,000 in net savings!
Another way to look at it:
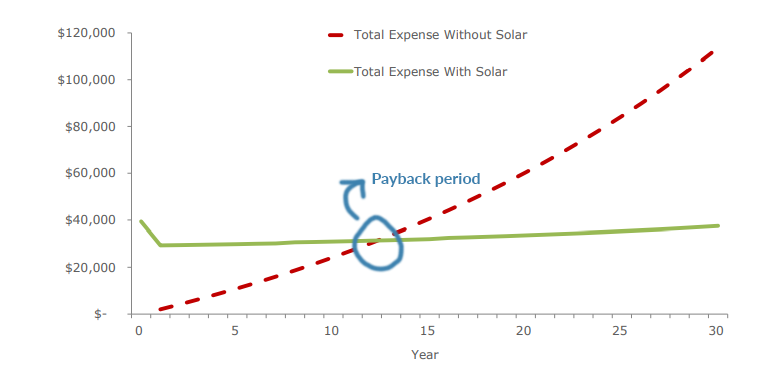
We often take for granted that an energy bill will show up from our utility company each month that we have to pay. It’s just a fact of life, right? Well, homeowners who go solar can take control of their energy costs and get out of this utility debt. The graph above shows the difference in cost for our homeowner with solar and without. In this scenario, it would take 13 years of saving with solar before the system pays for itself and the cash flow becomes positive. From then on out, our homeowner is enjoying pure energy savings!
What about your home?
Want to know how much solar panels might save for your home? Talk to one of our non-commissioned solar experts today to get a no-pressure quote. It’s a great way to invest in your home, your wallet, and the environment.


